 Fraunhofer Institute for Applied Information Technology FIT
From platform to systems
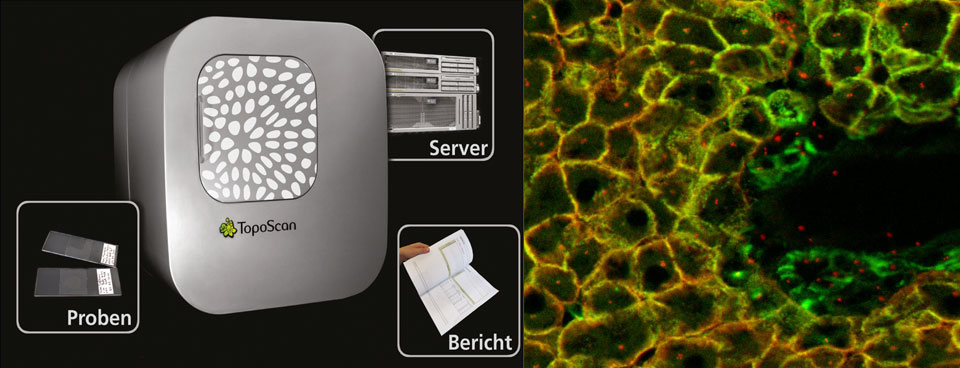
TopoScan is a modular hardware-software platform for the automated high content analysis (HCA) of biological samples. Its unique software-driven architecture combines two properties within one system:
Its powerful image and data analysis capabilities enable research and diagnostic applications that could not be handled in an automated procedure before. There are two ways in which the TopoScan platform can be used to realize specific applications:
This completely new software-intensive approach to automated instruments has been validated with several different biomedical applications.
The TopoScan system can be equipped with multiple detection mechanisms using a common path through standard objectives installed in an automated revolver.
Bright field Imaging
Bright field images can be acquired with a reflected light illumination (transmitted light under development).
Fluorescence Imaging
Fluorescence images can be acquired with a very high sensitivity camera system. Multiple filter sets (up to 8 filters) can be switched electronically.
Confocal Laser Scanning
A wide-area confocal laser scanning module can be installed in parallel to a camera imaging module, operating at the limits of optical resolution. Up to four laser sources can be plugged in.
Single Molecule Detection
The laser unit can also be used for single molecule detection based on fluorescent markers, using our proprietary and patented algorithm for analyzing photon statistics.
The TopoScan system can employ multiple software-driven scanning strategies to deal with scanning large samples or locating the right regions of interest. Multiple scanning tables are available as options depending on precision, speed and price requirements.
Autofocus Map
A series of locations is used to calculate the focus plane so that repeated autofocus operations can be avoided for faster scanning.
Tiled Scanning
A sample can be scanned through a motorized stage by acquiring multiple camera images. Multiple fluorescence channels can be quickly imaged serially to achieve the highest sensitivity.
Continuous Scanning
Measurements can take place while the sample is moved with a piezo scanner (used for laser scanning).
Time Series
A set of locations can be scanned multiple times to observe changes.
3D Stacks
Images can be acquired in multiple z-planes, in particular in confocal scanning.
Focused Scanning
After scanning the whole sample area with low magnification, image analysis will identify the structure of the sample and will select further regions to be scanned in detail (e.g., for multiple samples on a slide, such as tissue micro arrays).
Tracking
Moving objects (cells or molecules) can be tracked for time series images.
The scanning modules use a number of software modules that influence the behavior and that can be adapted for particular applications:
Content-Based Autofocus
Automatically determining the right focus plane ultimately depends on the type of sample and the content expected. An autofocus model describes the different foci (such as top of cover, bottom of cover, etc.) and thus increases robustness of finding the right plane even in difficult areas. The autofocus model can also incorporate characteristic image features learnt from examples.
Region Classification
Using a number of example sections, a sophisticated image analysis procedure employing supervised learning will classify the whole slide into different regions to identify substructures.
ROI Selection
Based on a region classification, strategies can be selected to determine which regions should be imaged in greater detail. The number of individual regions can be restricted to a statistically valid selection of areas.
Slide Structure Recognition
Based on region classification and other image analysis procedures, spatial structures on the slide can be recognized, for example, marks, labels, or individual sections of a tissue micro array.
Samples can be loaded and held in the system in different ways. Bar code detection can be incorporated.
Multiple Slide Holder
Multiple slides or samples can be loaded onto a slide holder whose different positions are then scanned one after the other (if loaded).
Automated Magazine
Sample slides can be loaded from an automatic magazine incorporated in the system (under development).
Microfluidic Chip
A sample is transferred through a microfluidic channel to increase sensitivity in single molecule detection.
Cell Chamber
A plate that holds multiple chambers with microfluidic medium supply can be used for analyzing cells or tissue under culture conditions. Temperature is controlled in the plate; other environmental conditions are controlled via the medium supplied. Substances can be applied automatically under various regimes.
Imaging methods create final images out of the raw data, using advanced algorithms that have information about the properties of the detection and scanning modules installed. The following methods are available:
Tile Stitching
The individual camera images are stitched together based on the properties of the optical system and the scanning table. Images may overlap to increase the smoothness of transitions. Distortion and vignetting of the optical system can be compensated.
Time Series
Images in a time series can be location-corrected for any offsets that occur due to limits of the location reproduction of the scanning table. Time series can also be treated to track slowly moving or changing objects so that they can be overlaid for final analysis.
Channel Registration
Multiple images of the same or related object can be aligned through registration algorithms so that the result is equivalent to a multi-channel image. In this way, for example, different markers in adjacent tissue slides can be integrated into a common marker set.
The data coming out of high content experiments need to be managed carefully to support analysis procedures and to fulfill regulatory requirements. The following functionalities are supported through appropriate software modules.
Image Archive
Images and other raw data can be stored in various standard formats. Instead of using a proprietary container format for the data, we separately describe all data with a semantic meta data annotation to facilitate handling and conversion for external tools.
Meta Data Model
Experimental results are accompanied by a lot of meta data, such as sample annotations and conditions, instrument settings, recognition results, human annotations, etc. We are using standard RDF techniques from the semantic web to capture and pass these data, so that they are accessible to many commercial and open source tools.
Distribution Service
Data must often be managed on different computers. We employ methods that facilitate the distribution of the instrument data on multiple machines. For example, some meta data for the samples might be managed by and imported from a laboratory information management system (LIMS). The resulting images are first stored on the internal disk in the microscope, while the later analysis is performed and stored on a department server.
Image analysis is one of the core bottlenecks of high content instruments. Image analysis demands vary a lot between applications. Therefore, it is not only necessary to draw from a large variety of methods, but users must be able to command these capabilities for their applications. We are using innovative techniques based on supervised and unsupervised learning to enable users to specify their demands by giving some examples.
Region Classification and Separation
Based on a multitude of mathematical features, our algorithms can discriminate regions with different visual characteristics. The user gives a few examples for each region type by pointing or painting, and the software applies these learnt characteristics to classify any number of subsequent images.
Object Identification
Our algorithms can detect objects by visual similarity even if no clear boundary can be set. This allows us to easily count cells even in a bright field image with confluent cells. Most kinds of compact objects can be recognized and counted this way.
Object Segmentation
Where the size, shape or border of objects is important, we can employ advanced algorithms that identify the most likely border by learning the difference between inside and outside from a number of examples. . These algorithms are tuned towards compact objects.
Object Classification
Objects recognized can later be classified in a separate step. Classification works by example and can draw on appearance as well as on shape, size and other parameters.
Object Aggregation
Recognized objects can be arranged into neighboring groups or groups enclosed by a larger region.
Structure Tracking
For non-compact structures like membrane segments or neurites, special algorithms follow the centerline of a recognized region.
Structure Profiling
Identified structures can be profiled perpendicular to their extensions. This helps to determine thickness, side structures or transport profiles.
Multi-Layered Modeling
Findings on multiple magnification levels can be linked. Decision procedures for these combinations can also be learnt through examples.
Dynamic Analysis
In time series images, the behavior of structures can be tracked over time and aggregated into time series population data, for example, to track cardiomyocyte contraction or cell invasion.
Once image or signal analysis has been performed, we have a wealth of data for a population of individual objects. This is analogous to cytometry. The challenge now is to find the right subpopulations, to recognize and measure their behavior, and to validate the findings visually and statistically. For this purpose, we have a number of data analysis modules that can be combined into analysis workflows.
Image Visualization with Overlay
Visual inspection of images is very important for quality control and generation of hypotheses. Analysis data can also be overlaid over the image for validation.
Plotting
Population data can be visualized in 2D multi-parameter dot plots and curve plots.
Visual Data Mining
Using our Info Zoom tool, symbolic and numerical data can be analyzed for completeness, groups and trends.
Cluster Analysis
Algorithms are available to group together objects with similar behavior to identify different responders and to classify populations.
Model Fitting
Curves and other mathematical models can be fitted to the data to extract parameters like dose-response, kinetic laws or other correlations.
An intuitive user interface is an important success criterion for specific applications or instruments. We have developed such user interfaces drawing everything together with just the right amount of variability for various customers. Most of them report an increased acceptance and increased sales due to the user-friendly operation and the quick availability of results.
Our team of designers and developers will quickly realize intuitive user interfaces based on platform-independent technology that runs on every computer and integrates well with current network and web technologies.